The User Interface That Puts the Business in Control
BI shouldn’t require training. It should require curiosity.
Most BI tools claim to be “user-friendly.” But look closer, and they often require:
technical understanding of filter logic
knowledge of how the data model is structured
awareness of which tables belong together
the ability to build custom visualizations
and most of all: time
And so we end up right back where we started:
A tool built for IT – but a need owned by the business.
We designed Homepal for people who work with questions – not with data
A leasing agent should be able to log in and instantly find:
“What units are currently vacant?”
“How many contracts did we sign last month?”
“What’s the trend in interest registrations?”
Without needing to:
know which tables sit behind the scenes
understand whether a field comes from the lease or the unit
build a new visualization
or ask IT
That’s why we built an interface that requires nothing but curiosity.
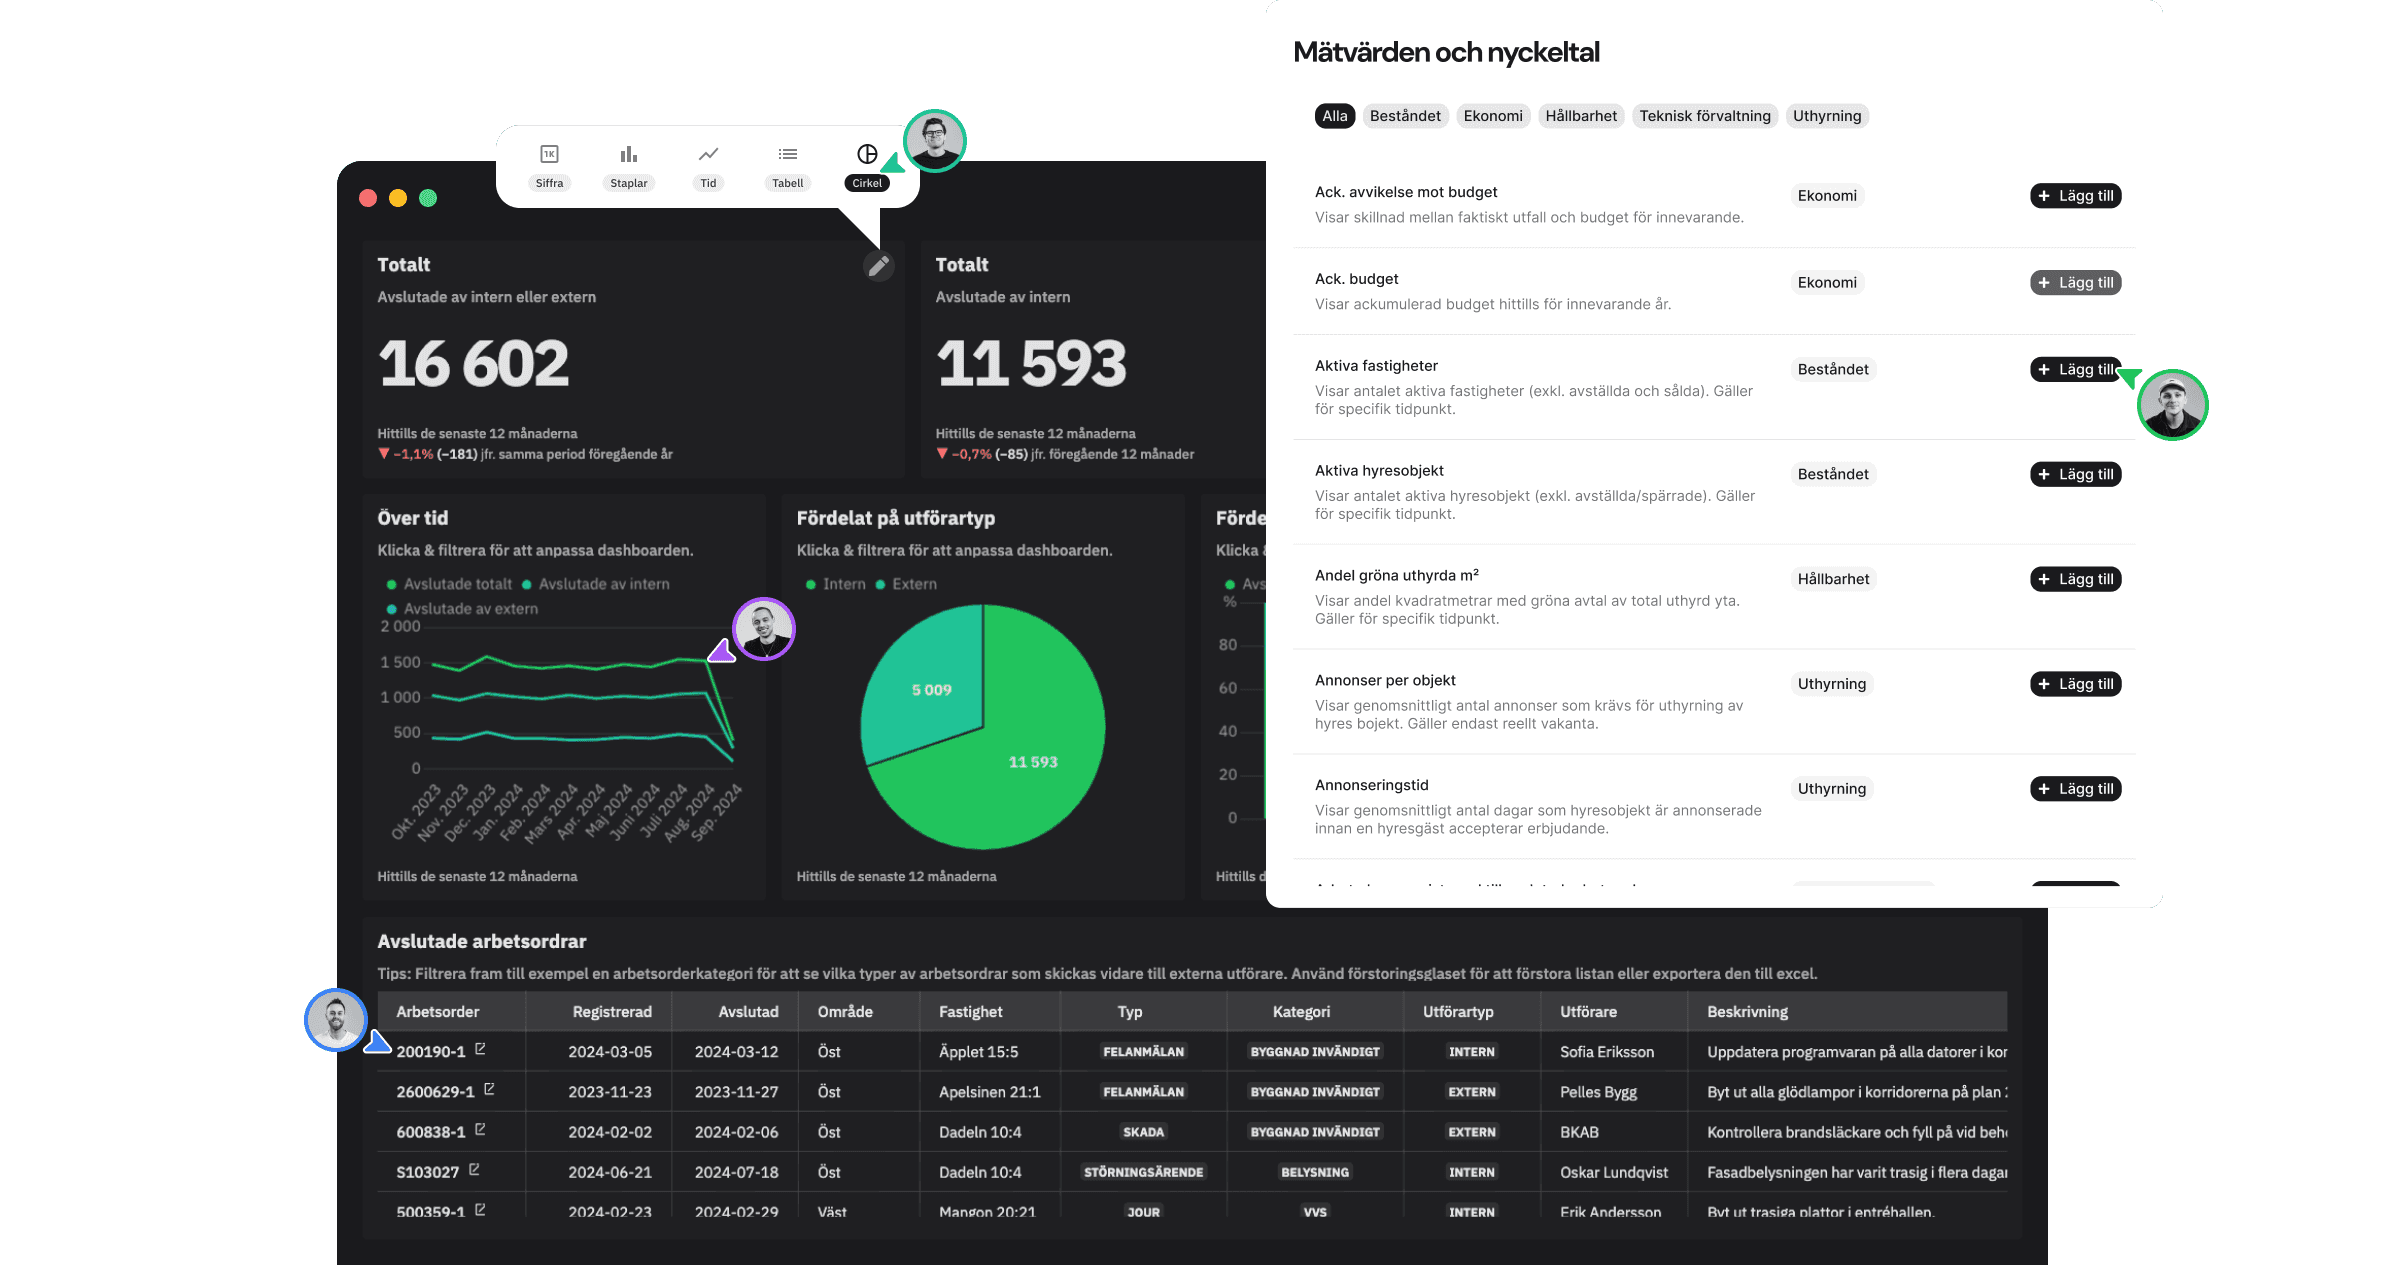
It all starts with one thing: the KPI
In Homepal, the KPI is always at the center. You choose what you want to measure—not how to build it.
For each KPI, you can instantly:
see the definition and calculation
use global filters (time, area, unit type...)
compare with previous periods or other segments
visualize trends or distributions
drill down to lists of linked units or contracts
And it works the same whether you’re tracking finance, leasing, sustainability, or operations.
It’s like a BI toolkit - where we’ve already prepped every piece
The customer’s role isn’t to build BI, but to:
choose relevant KPIs
combine them in dashboards
use them in meetings, reports, or decisions
and act on what they see
Just like a website builder gives marketing control over messaging - Homepal gives the business control over the numbers.
And that’s why we don’t require training
We only ask that you:
know what you’re curious about
understand your business
and have a need to make better decisions
The rest—filter logic, data model, visualizations, calculations - we’ve already built in.
Next time we’ll show how our users get insights without asking IT - and how BI can become self-driving: